Campaign data that is actually about your race.

Politiquera tells a Texas campaign which precincts decide the race, which doors to knock, who has already voted — and on election night, what the count is doing while there is still time to act on it.

Or try the free map — no login →

Statewide coverage across all 254 Texas counties. Proven live through the 2026 cycle in Texas 15 — 11 counties, 288 precincts, read every minute of election night.

254Texas counties — every one, on election night
5.4 millionvoter records on file and growing
2.4 millionballots tracked in the 2026 general
Firstcounties on our board before the state feed showed a vote from them
Free · no login

Have They Voted Yet?

A public map of who has already cast a ballot. Search a name or an address, or watch turnout build across the Valley in real time as each county roster lands.

It is free, it needs no account, and it is the same data engine behind everything we sell.

Open the map →
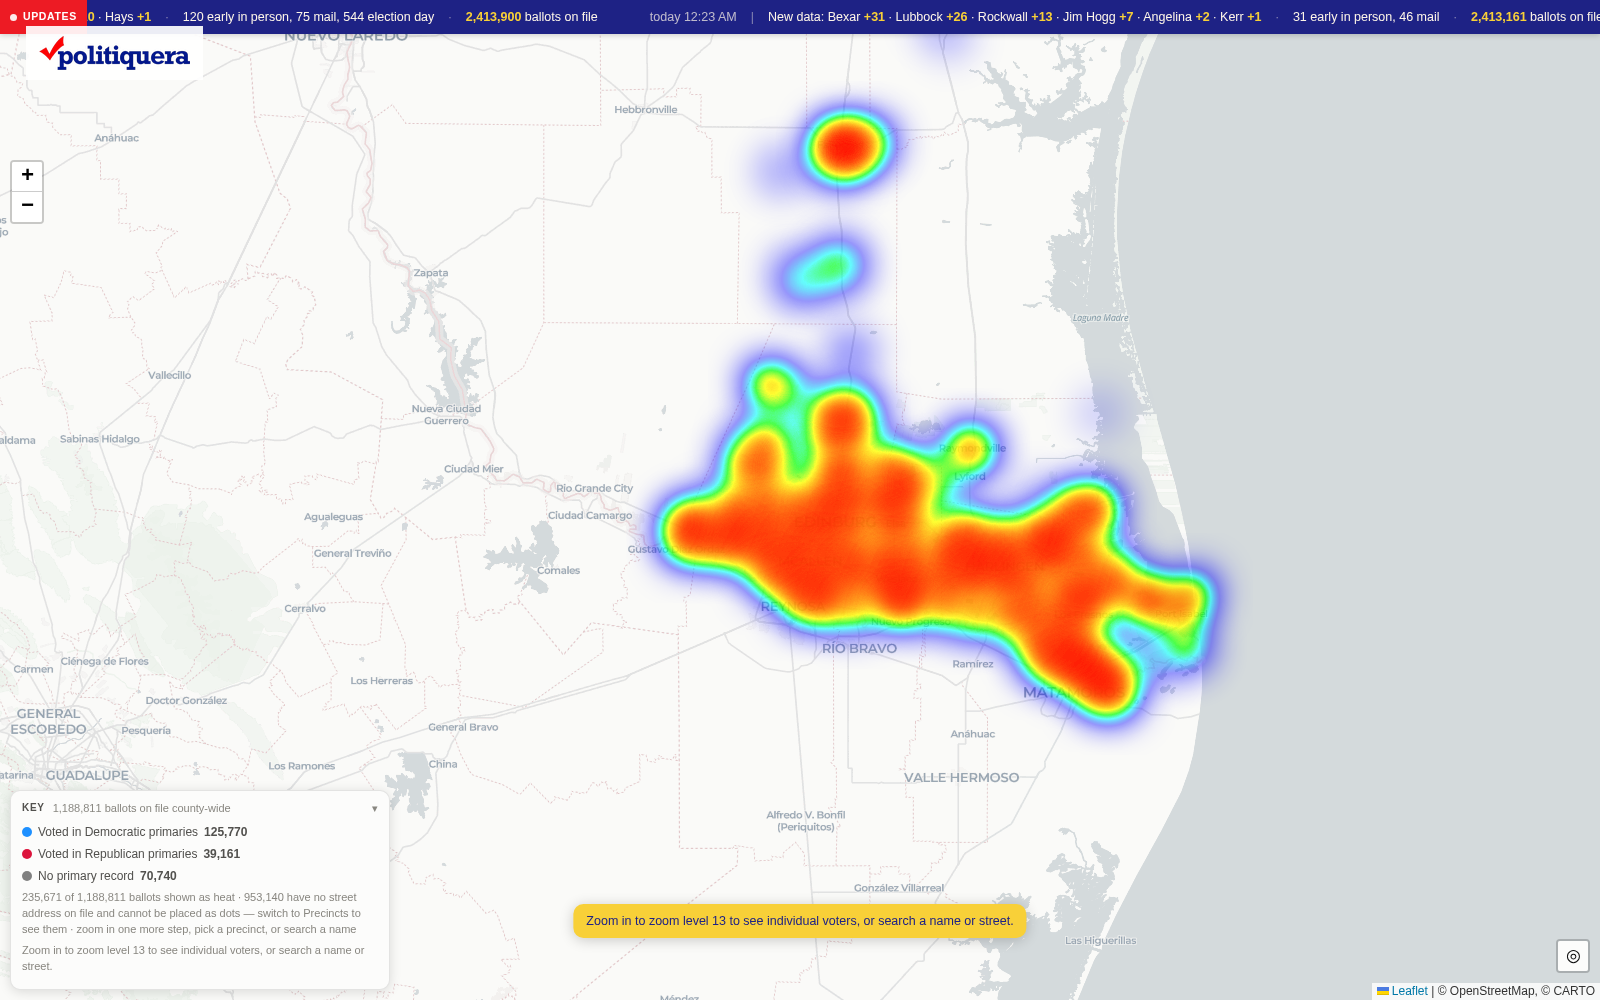
Turnout heat map across Texas
Turnout density, updated as each county publishes.
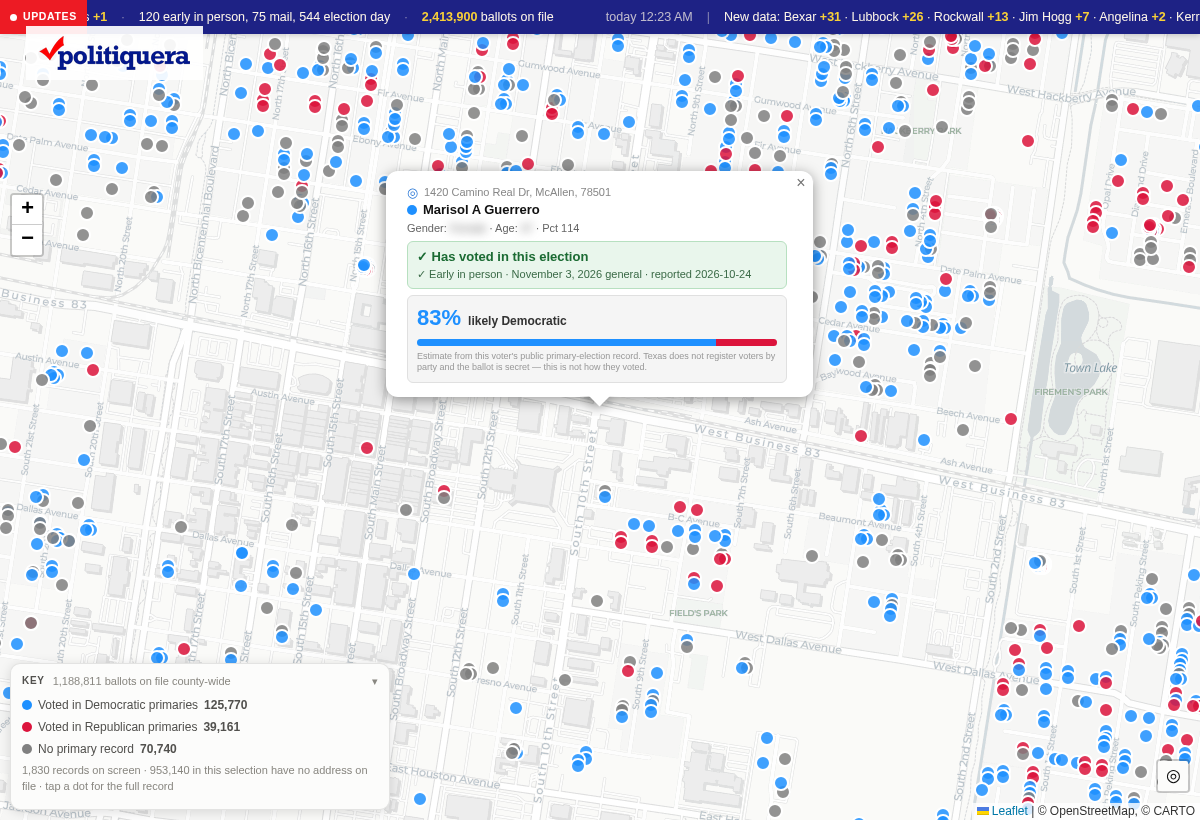
A voter record card on the map
Tap any dot for the record. This example is an invented person at an invented address — the live map shows the public record.

Every ballot, down to the door

Zoom in and the heat becomes households. Each one carries whether they voted, how, when it was reported, and what their public primary history suggests.

Texas does not register voters by party and the ballot is secret. We show the public record and an estimate from it — never a claim about how anybody voted.
The paid platform

Three phases of a campaign. Buy one, or the whole cycle.

Each phase stands on its own. Together they take a campaign from filing day to the moment the race is called.

Phase 1

Ground Game

Know where the race is before you spend a dollar.

  • Precinct targeting from every prior primary
  • Mail universes by household, deduplicated
  • Downloadable mail files
  • Printable precinct walk maps
  • Lists of registered voters who sat out last cycle
Phase 2

Early Vote

Twelve days of knowing who has already voted.

  • Daily turnout against the last comparable cycle
  • Breakdowns by precinct, city, age and party history
  • Polling-place activity and wait times
  • Who on your list has voted — and who has not
Phase 3

Election Day

The count as it lands, against your own targets.

  • County and precinct results from every source that publishes
  • Every number checked before it reaches the screen
  • Goal tracking per county
  • A display built to be read across a room
Phase 1 · Ground Game

Walk lists that know the street

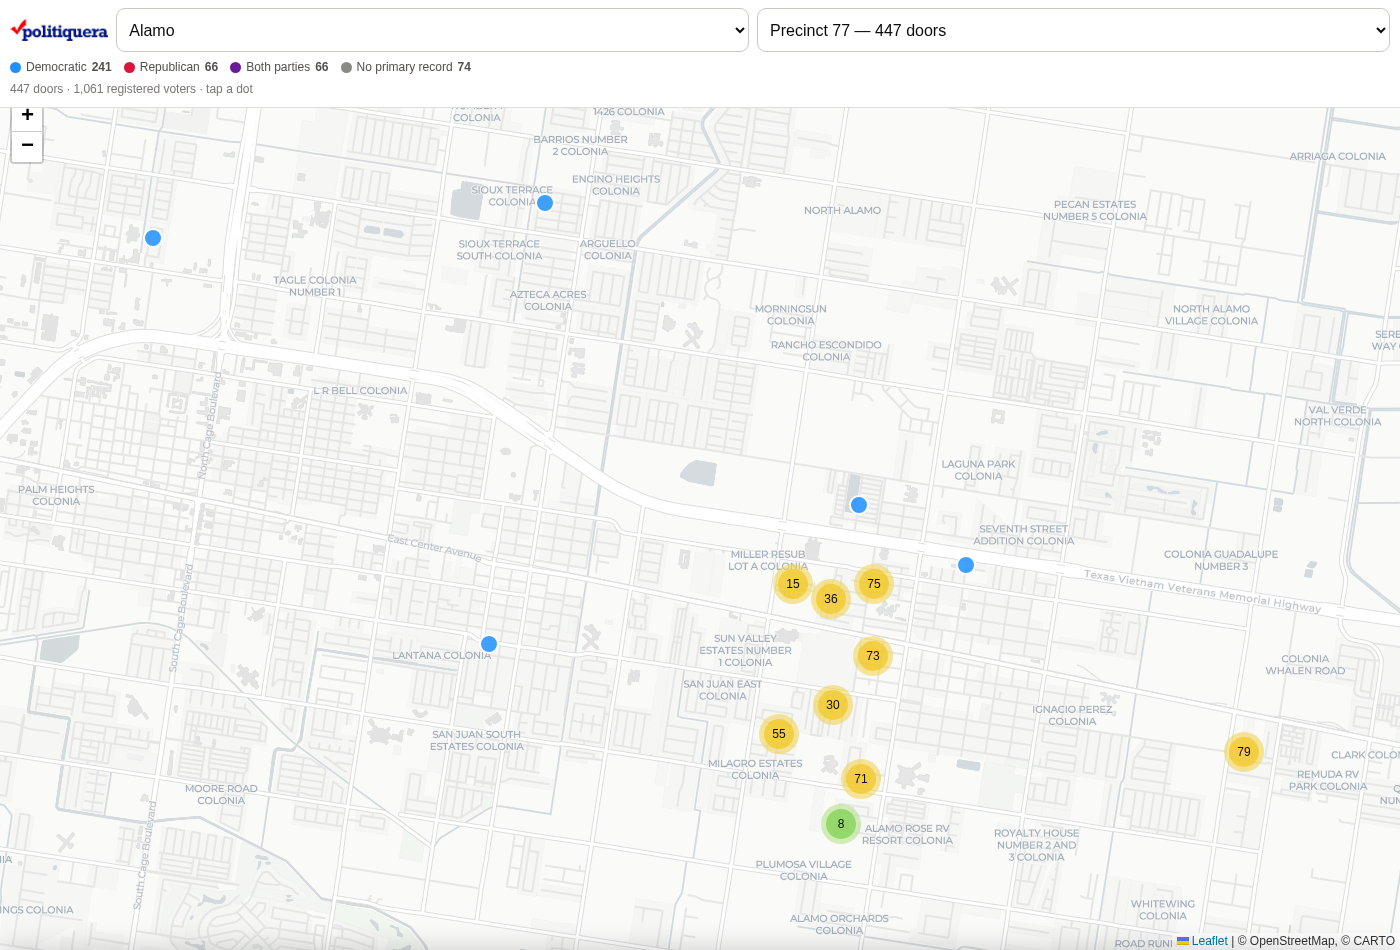
Pick a precinct and every household on the walk list appears as a door — colour-coded by primary history, clustered until you zoom in, tappable for who lives there.

Export it as a mail file or print it as a map and hand it to a volunteer.

Block walker map showing doors in a precinct
447 doors in one precinct, by party history.
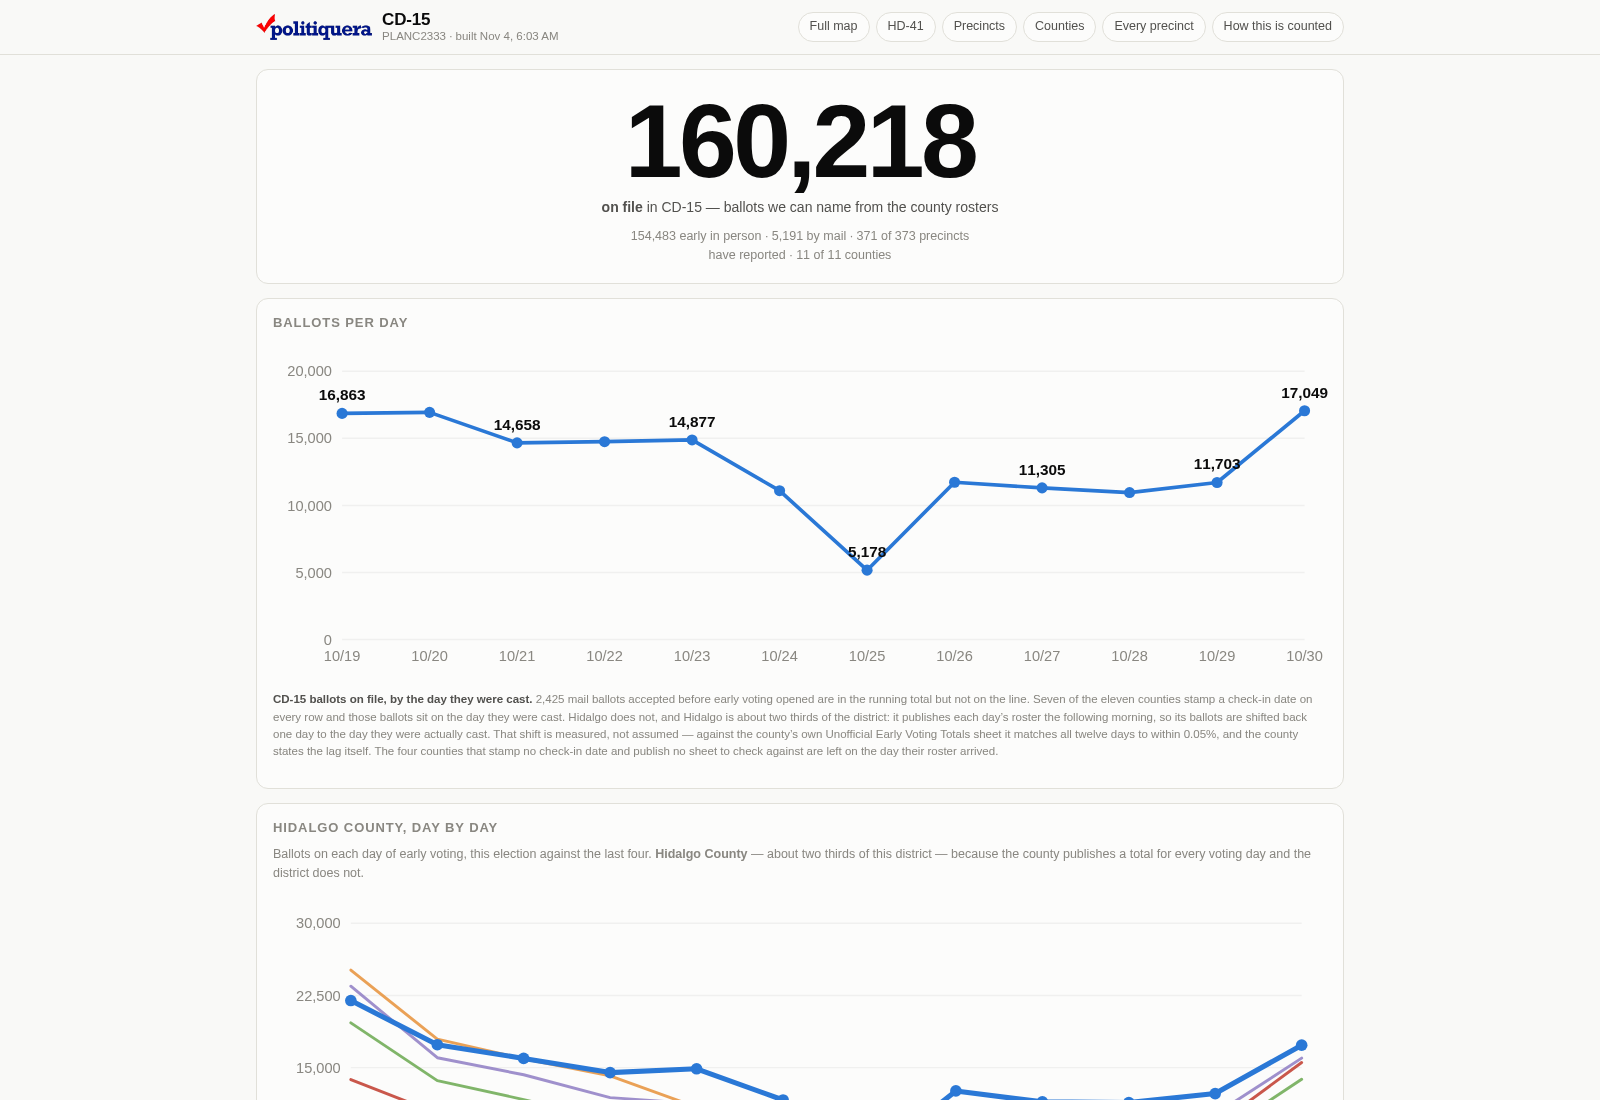
Early voting dashboard
Ballots per day against the four previous cycles.
Phase 2 · Early Vote

Is the pace good enough?

Every day of early voting measured against the last comparable election, so a campaign knows whether its turnout operation is working while it can still change something.

Counties publish on different clocks and some stamp no check-in date at all. We reconcile that and say plainly which days are solid.

Phase 3 · Election Day

Results you can stand behind

Every county that publishes, read the minute it posts. Three independent sources, cross-checked against each other, with a verification gate that refuses to show a number that fails it.

A county reporting more votes than it has registered voters does not reach the screen. Two sources disagreeing about the split is reported, not hidden.

Election night dashboard
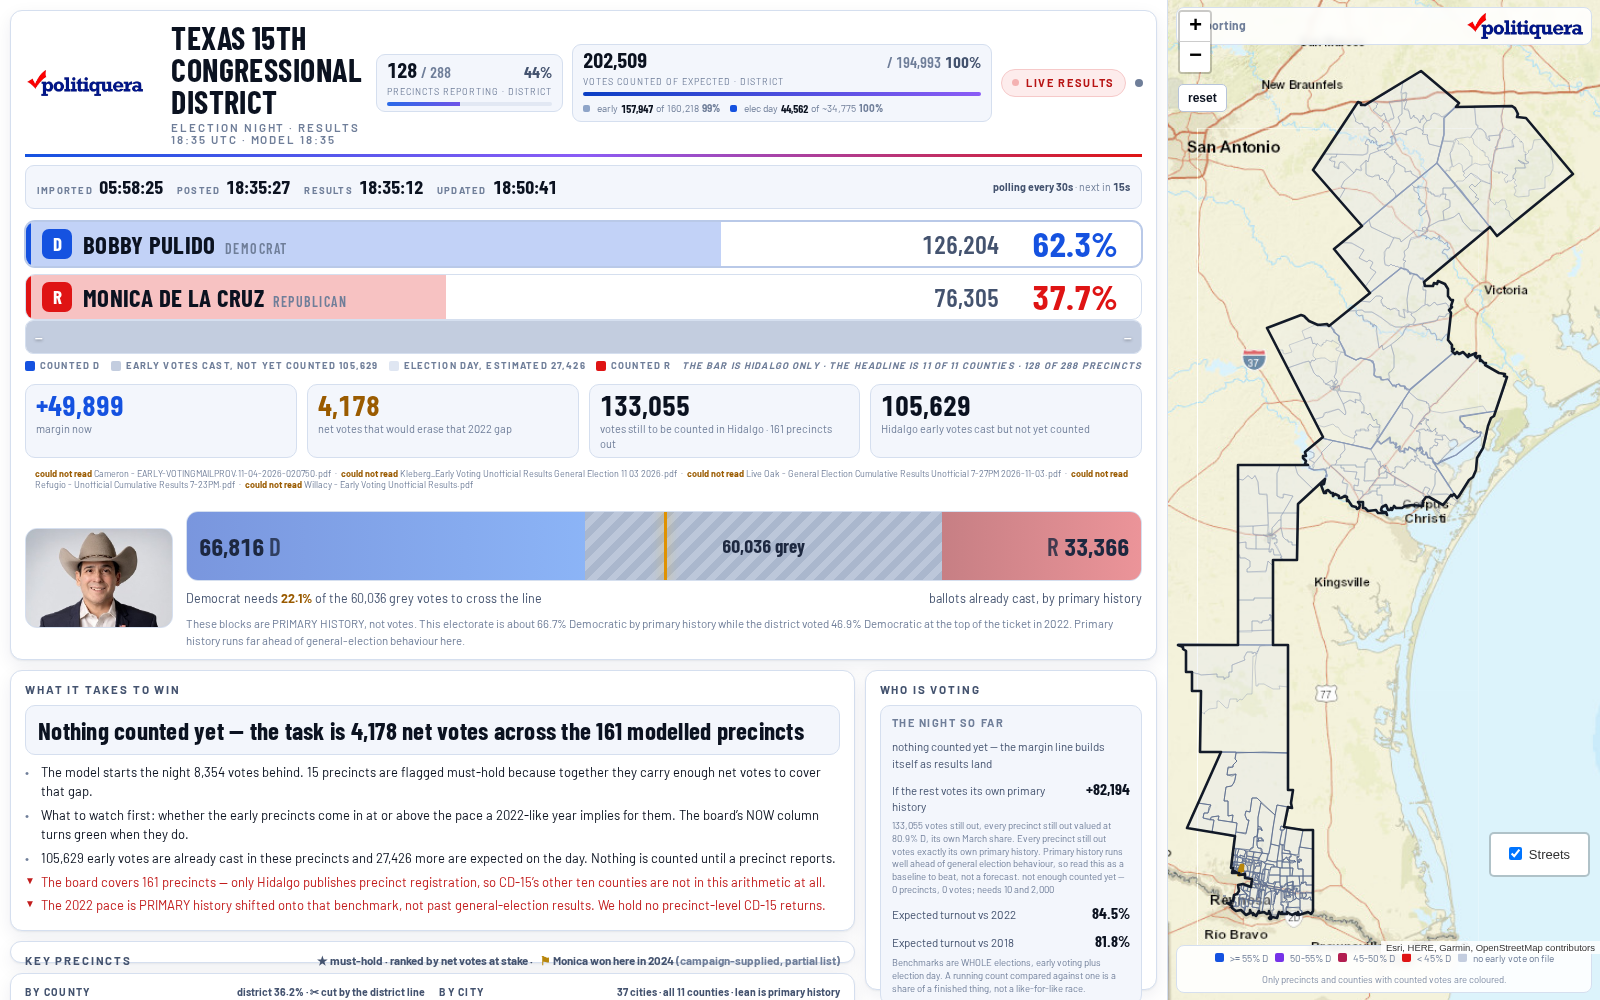
The CD-15 board on election night, 2026.
Precinct detail card
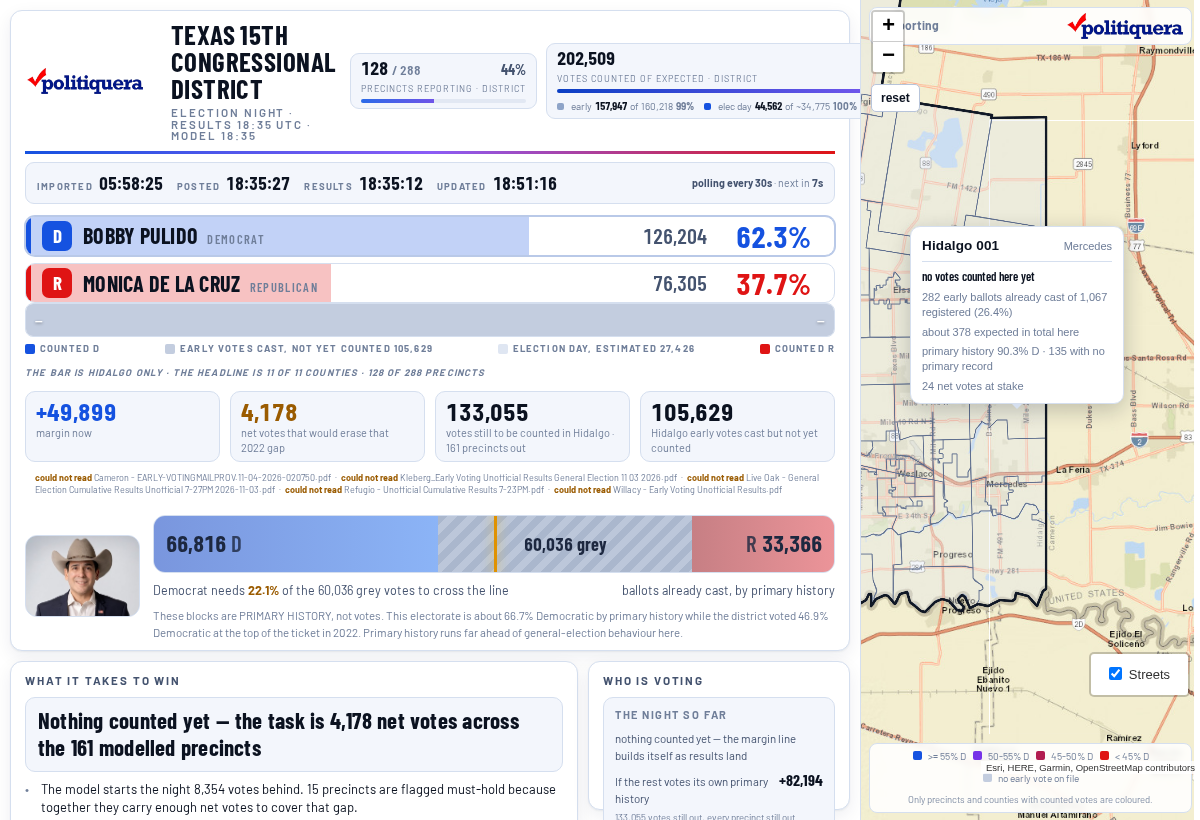
Hover any precinct for its full picture.

Down to the precinct, live

Your candidate's share of the votes cast and of the precinct's registration — two different questions, both answered. Plus how it is running against its own primary history, and how much vote is still out.

Phase 3 · the room

Built for the screen behind the candidate

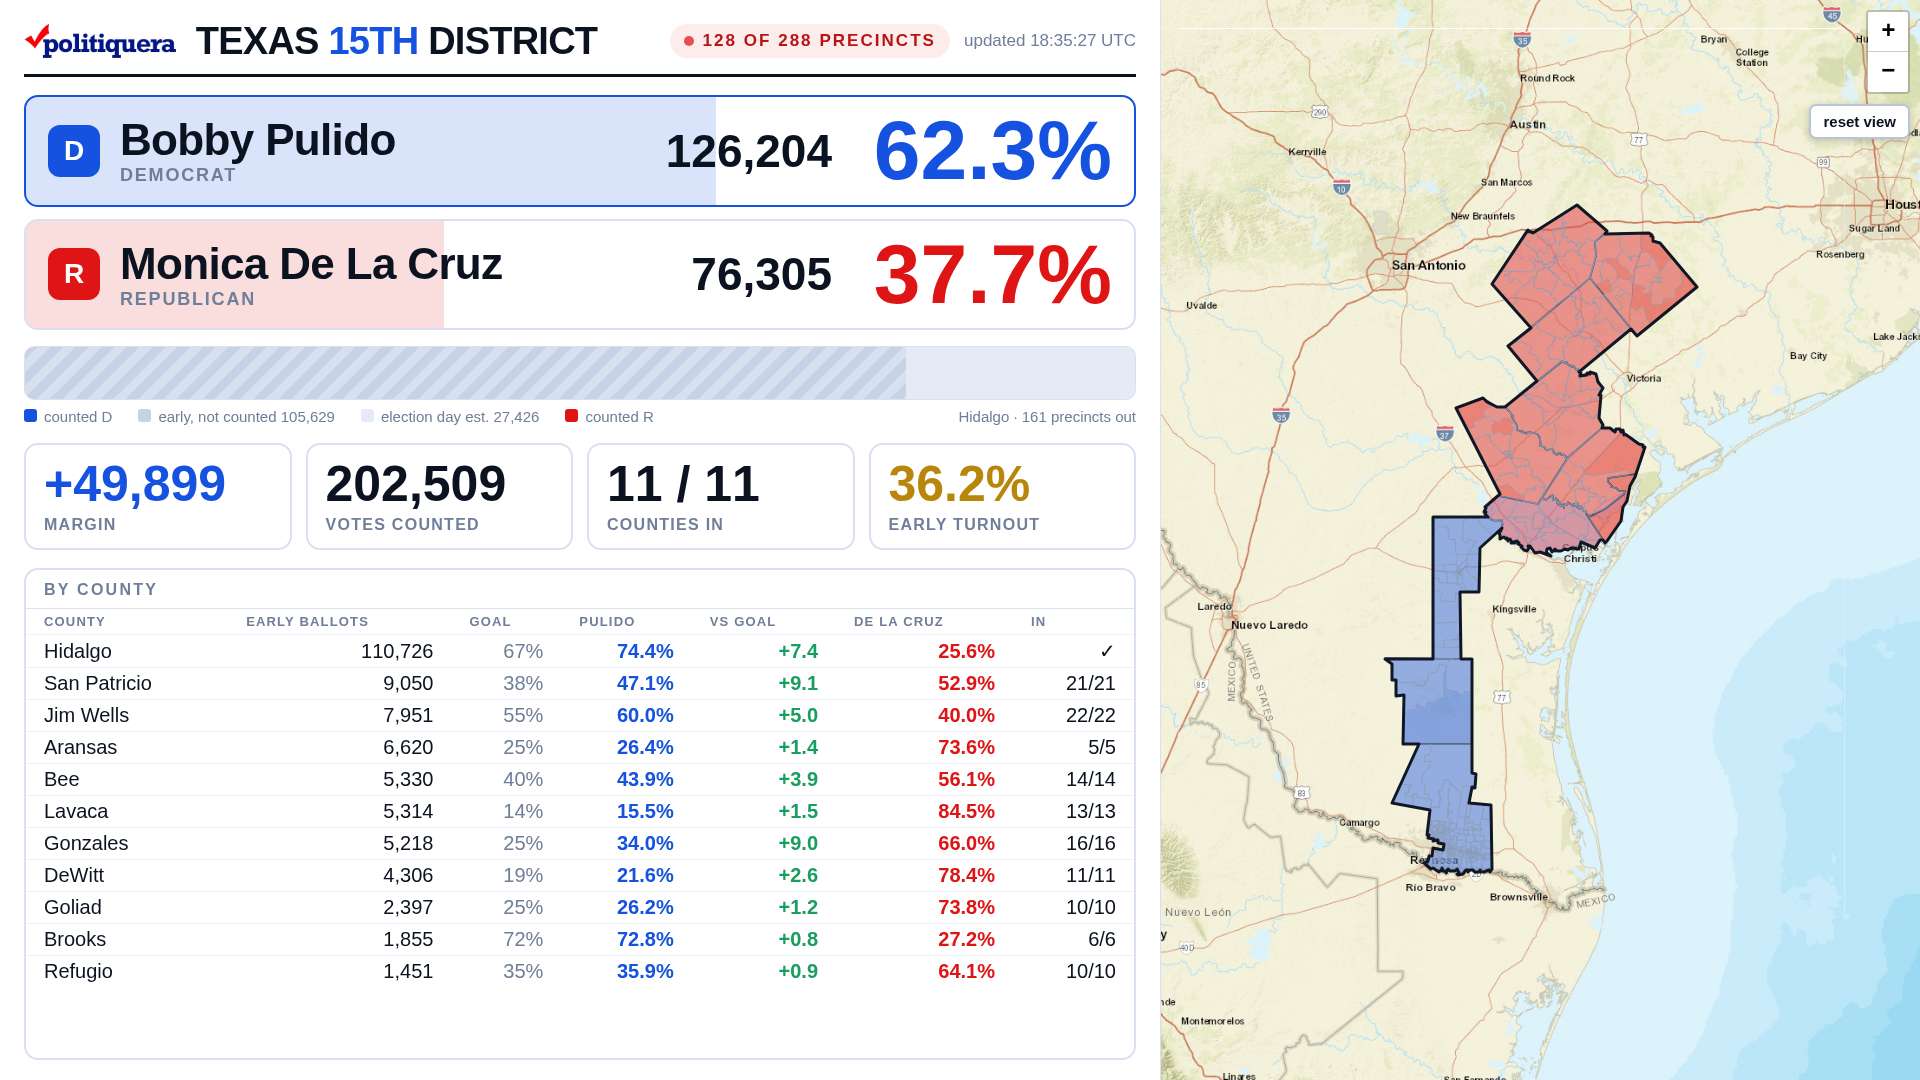
1920x1080 election night room display
A fixed 1920×1080 display that scales to any projector, refreshing every thirty seconds once polls close.
Coverage

Any race, any county in Texas

Election-night results come from the Secretary of State's own feed, which carries all 254 Texas counties and every contest on the ballot — 584 of them in 2026. Where a county publishes its own precinct file, we read that too and get there first.

The voter spine already holds 5.4 million records across all 254 counties, and 2.4 million ballots from the 2026 general. Adding a new district is loading the counties it covers — not building a new system.

What we can run tomorrow

  • Congressional, State Senate and State House races
  • County judge, commissioner and JP precincts
  • City council, school board and bond elections
  • Primaries, runoffs and generals
  • Single-county races and districts spanning a dozen
Case study

Texas 15th Congressional District, 2026

A seat the other side had just redrawn in their own favour, held by an incumbent who won it by 14 points — flipped on a 38.8 point swing. Read the full story →

Eleven counties. 288 precincts. Three of those counties publish nothing a machine can read. We read all eleven anyway — and ten of them matched the Secretary of State to the individual vote.
62.3% final district share
+49,899 margin
11 / 11 counties over target

The campaign set a target share for every county. Here is how the night finished against them — over target in all eleven.

CountyResult Targetvs target
San Patricio47.1%38%+9.1
Gonzales34.0%25%+9.0
Hidalgo74.4%67%+7.4
Jim Wells60.0%55%+5.0
Bee43.9%40%+3.9
DeWitt21.6%19%+2.6
Lavaca15.5%14%+1.5
Aransas26.4%25%+1.4
Goliad26.2%25%+1.2
Refugio35.9%35%+0.9
Brooks72.8%72%+0.8

Unofficial results as reported on election night, 3 November 2026. Targets supplied by the campaign.

CD-15 is where this was proven, not the limit of it. The same capability runs for every one of Texas's 254 counties — eleven of them simply happened to be the ones in this district.

Read the full case study →

Why Politiquera exists

The data was always there. The way to read it was not.

I built Politiquera because a candidate who wants to know what is happening in their own race should not have to go through three layers of consultants to find out.

The records are public. Who is registered, who voted, which precinct they live in, what they have done in past primaries — all of it sits there in county files, free for anyone to download. What did not exist was any way to actually read it. No analysis. No charts. No maps. No presentation. And nothing that let one piece of it speak to another.

So for the last ten years I did it by hand, for whoever asked. Hours of collecting, aggregating, sorting, normalising, formatting and finally displaying — until it came out the other side as something a person could look at and understand.

I have been around this in one form or another for twenty years, and politics runs in my family. It has always mattered to me. I treat an election the way other people treat the Super Bowl, and I have taken that same obsessiveness and pointed it at the data.

It is my way of contributing to democracy with the thing I am actually good at: taking dense technical analysis and making it reachable in the fewest clicks possible, so the person looking at it sees exactly what matters to them — whether that is the campaign manager, the data analyst, the field director running doors, or the candidate.

Drew Lentz Founder, Politiquera · Rio Grande Valley, Texas

We show our work

Every number on a board can be traced to the county file it came from. Where two sources disagree, we say so rather than picking one quietly.

A number that fails its check never reaches the screen

A county reporting more votes than it has registered voters is held back and named, not displayed. Your candidate reads these numbers out loud.

We never claim how anyone voted

The ballot is secret and Texas does not register voters by party. We report participation, which is public, and label every estimate as an estimate.

Stronger together

Politiquera reads the public record. VoterWiFi captures what happens in the room. Put the two together and a campaign stops guessing who showed up.

  • Positive ID at the event. Someone connects at a rally, a block walk staging point or a field office — and that is a confirmed identity, not an inferred one.
  • On-site visits become data. Attendance stops being a clipboard and a guess, and becomes a record you can act on the next morning.
  • Targeted acquisition. Reach the people who already raised their hand, and match them straight back to the precinct-level picture.
  • Turnout you can verify. The people you captured on-site can be checked against who actually voted — so you learn which events moved ballots.
  • Your own list, not a rented one. Every connection builds an asset the campaign keeps, rather than renting reach from a platform.
  • One picture, not two tools. On-site capture lands beside the public record in the same place, so there is nothing to reconcile by hand later.
Get started

Tell us about your race

We will tell you what we can see in your district — which counties publish usable data and which do not — before you commit to anything.