Case study · November 2026

Eleven counties. One seat. A 38-point swing.

How a first-time candidate in a district that had gone Republican flipped it — with the numbers in front of him the whole way.

62.3%final district share
+49,899margin of victory
38.8 ptsswing from De La Cruz's 2024 margin to Pulido's
11 / 11counties finished over the campaign's own target
The race

A district nobody expected to move

Texas’ 15th runs from the Rio Grande Valley to the edge of the Hill Country — eleven counties, 288 precincts, 443,173 registered voters inside the district line. It is not one electorate. It is a dense, heavily Hispanic, historically Democratic south anchored on Hidalgo County, and a rural, overwhelmingly Republican north where a Democrat is lucky to clear a quarter of the vote.

Two years earlier the incumbent, Monica De La Cruz, had held the seat 57.1% to 42.9% — a 14.2 point win. Donald Trump carried the district by 18 points the same night. And in 2025 Texas Republicans redrew the congressional map hoping to pick up more Valley seats, not lose one. Nobody had CD-15 on a list of districts to flip.

The Democratic nominee, Bobby Pulido, had never run for office. Born and raised in Edinburg, the son of a farmworker who became a musician, he is a Latin Grammy–winning Tejano artist and a small-business owner — a household name across South Texas, and a complete newcomer to politics.

2022De La Cruz takes the seat; the district votes 53% Republican at the top of the ticket
2024She holds it by 14.2. Trump carries the district by 18
2025The map is redrawn — Republicans expecting to gain in the Valley
2026Pulido wins by 24.6. The seat flips
R +14.2  →  D +24.6

A 38.8 point swing in one cycle, in a district the other side had just redrawn in their own favour. Measured against Trump's 2024 margin rather than the incumbent's, it is 42.6 points.
What a campaign actually needs

Three problems, three phases

A district this size breaks a campaign in three different ways, at three different times. Each one is a data problem before it is anything else.

Before: where is this race actually won?

Eleven counties cannot be worked equally. The campaign needed to know which precincts carried enough persuadable turnout to matter, which households to put mail in front of, and which doors were worth a volunteer's Saturday. That came out of the public participation record — precinct by precinct, household by household — as target lists, mail files and printable walk maps a field director could hand to someone.

During: is the turnout operation working?

Twelve days of early voting, with every county on its own schedule. Each day's turnout was measured against the same district in prior cycles, cut by precinct, city, age and party history — so the campaign could see whether its own voters were showing up while there was still time to do something about it, not in a post-mortem.

On the night: what is actually happening?

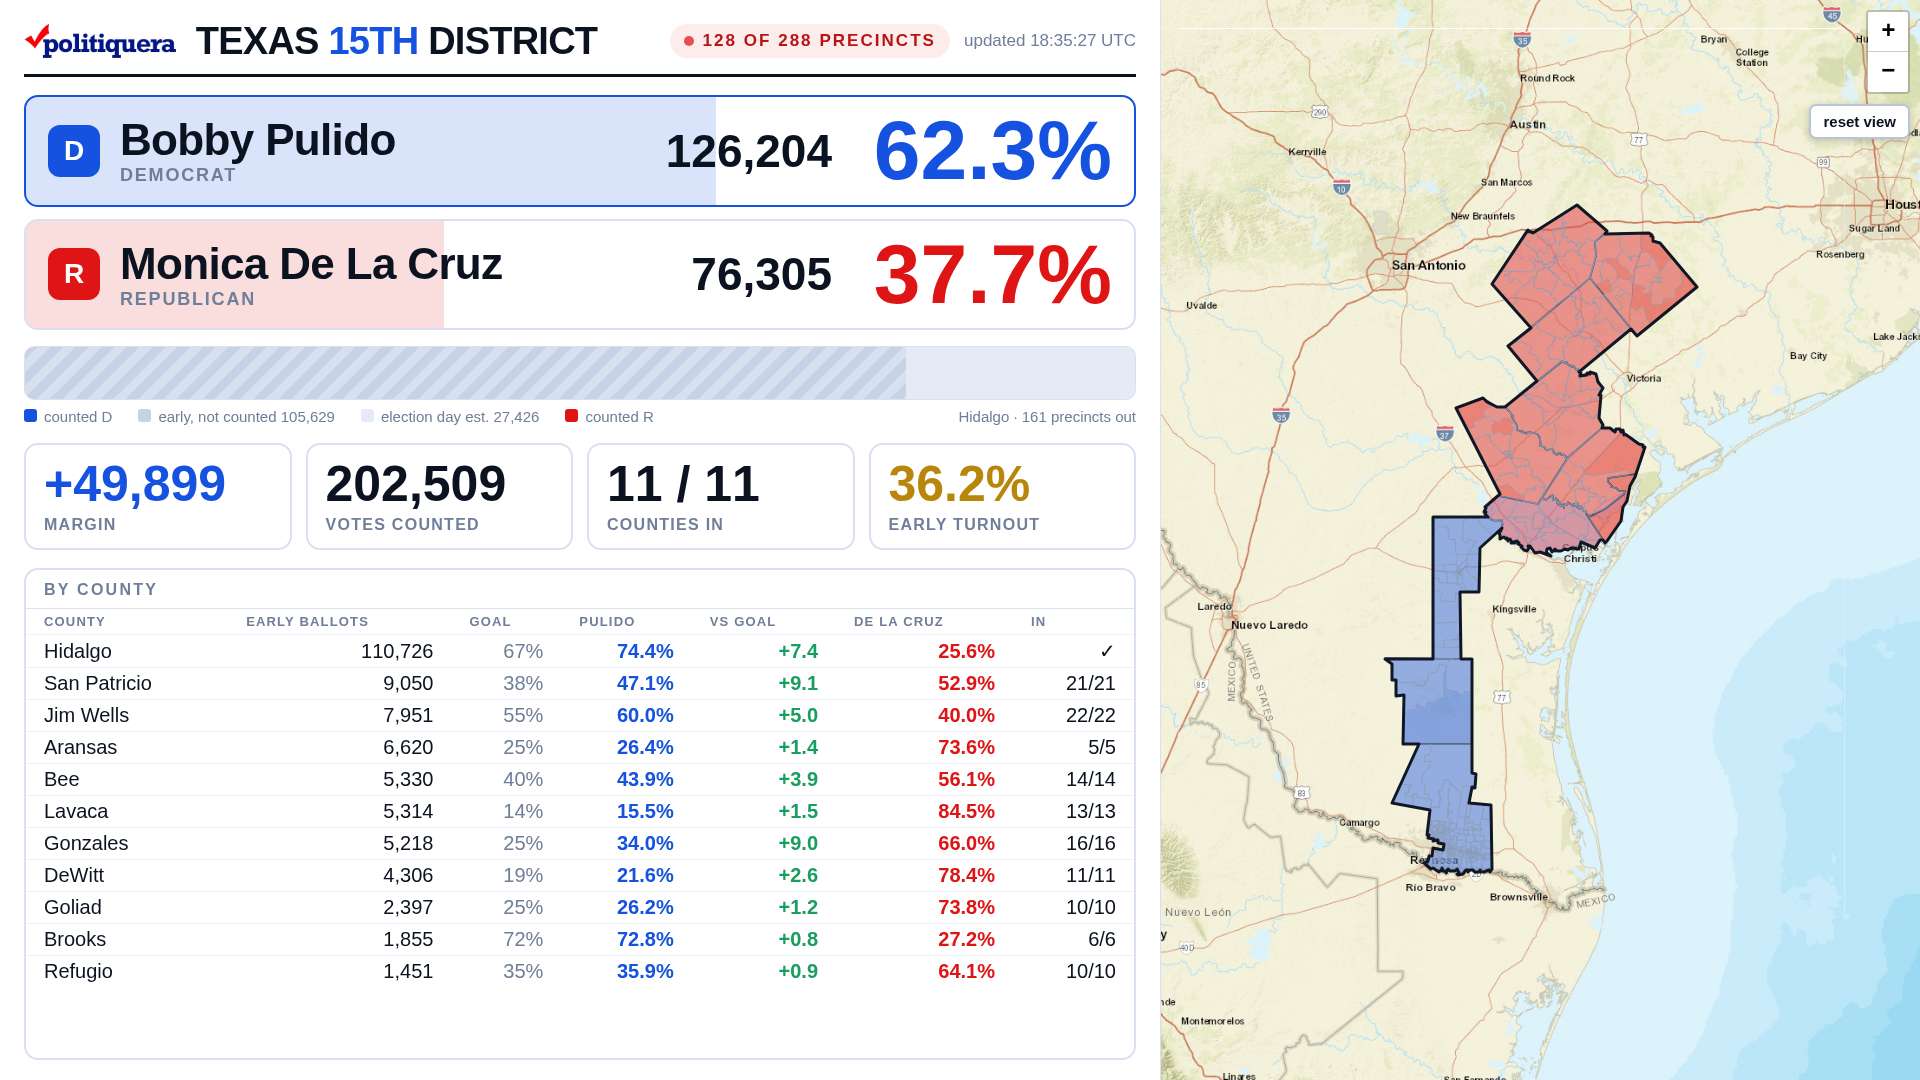
Eleven counties report on eleven different clocks, in eleven different formats, and three of them publish nothing a machine can read at all. The campaign had one board — county by county, precinct by precinct, measured against the targets they had set themselves — refreshing every minute from the moment polls closed.

Election night

Every county, every minute

From 7pm the board updated on a one-minute cycle. Each county appeared the moment it posted anything, measured against the campaign's own target for that county — not a national model, not a pundit's expectation.

By the time the race was called, the board carried all eleven counties and 202,509 votes — and ten of the eleven reconciled to the Secretary of State's own figures to the individual vote. The eleventh was ahead of the state, not in conflict with it.

The election night board
The board as it ran on the night, built to be read from across a room.
The result

Over target in all eleven

The campaign set itself a share to hit in every county. Not one of them came in under it — in the reddest corners of the district and the bluest alike.

CountyVotes ResultTarget vs target
San Patricio12,50747.1%38%+9.1
Gonzales6,63934.0%25%+9.0
Hidalgo135,42074.4%67%+7.4
Jim Wells10,74760.0%55%+5.0
Bee7,12043.9%40%+3.9
DeWitt6,19021.6%19%+2.6
Lavaca8,46015.5%14%+1.5
Aransas8,17926.4%25%+1.4
Goliad3,32926.2%25%+1.2
Refugio2,07235.9%35%+0.9
Brooks1,84672.8%72%+0.8

Unofficial results as reported on election night, 3 November 2026, and subject to canvass. Targets supplied by the campaign. 2024 figures: De La Cruz 127,804 (57.1%) to Vallejo 95,965 (42.9%).

What surprised us

We thought the software was broken

Early in the night the board was showing counties that nothing else had. Not the state. Not the wires. Not the networks. The first assumption in the room was that something had gone wrong — that we were reading a stale file, or a test file, or inventing numbers out of a bad parse.

We stopped and checked it against the county's own published document, line by line. The numbers were right. We were simply there first.

7:13pmA county posts its early vote
On the boardWhile the state feed still showed zero votes from it
10:40pmThe largest county posts its count
Read and liveWith the state still showing 0 of 160 precincts there

That gap is not luck and it is not a scrape running faster than somebody else's. It is the product of a decade of building data sets we own — aggregated, normalised and structured for three things in this order: speed, efficiency, and above all accuracy.

The result is that every figure from the night is still there: queryable, cross-referenced, and available instantly. Not a PDF in a folder somebody has to go and find. A campaign that works with us does not start from zero next cycle — it starts from everything that already happened, ready to be asked a question.

How it was reported

A flip nobody had forecast

The result was called on election night and covered statewide and nationally as one of the night's genuine upsets.

Headlines link to the original reporting. Politiquera is not affiliated with, and makes no claim of endorsement by, any of these outlets.

The data did not win this race. It meant that at every point where somebody had to decide something — which precinct, which doors, which day, which county to worry about — they were deciding with the real numbers in front of them instead of a guess.
Why it matters to you

Unique, effective, and repeatable

Nothing about this was built for CD-15 alone. The same capability runs for any race in any of Texas’ 254 counties — congressional, legislative, county, city, school board, bond. Single county or a dozen. Primary, runoff or general.

What took a decade to build is the ability to take whatever a county publishes, in whatever shape it publishes it, and turn it into something a candidate can read in one glance. That part is ours. The result is a campaign that knows where it stands on any given day of the cycle rather than on the day after it ends.

It is repeatable. Including for whoever runs against you.

What would this look like in your race?

Tell us the seat you are running for. We will come back with what we can see in your district before you commit to anything.

Request a demo